Medium-range precipitation forecasting based on GraphCast
![]()
![]()
![]()
Overview
This module provides medium-range precipitation forecasting based on a pre-trained GraphCast backbone. We add a trainable graphcast module after the pre-trained backbone and fine-tune. The architecture of the model displayed in the following.

Technology Path
MindSpore Earth solves the problem as follows:
Data Construction.
Model Construction.
Loss function.
Model Training.
Model Evaluation and Visualization.
Download the training and test dataset: dataset
[36]:
import random
import numpy as np
import matplotlib.pyplot as plt

from mindspore import set_seed
from mindspore import context, ops
The following src can be downloaded in graphcast/src.
[8]:
from mindearth.utils import load_yaml_config
from mindearth.data import Dataset

from src import get_coe, get_logger, init_tp_model
from src import LossNet, GraphCastTrainerTp, CustomWithLossCell, InferenceModuleTp
from src import Era5DataTp
[9]:
set_seed(0)
np.random.seed(0)
random.seed(0)
You can get parameters of model, data and optimizer from config. Set tp: True in GraphCastTp.yaml.
[16]:
config = load_yaml_config("./GraphCastTp.yaml")
context.set_context(mode=context.GRAPH_MODE, device_target="Ascend", device_id=5)
Data Construction
Download the statistic, training and validation dataset from dataset to ./dataset.
Modify the parameter of root_dir and tp_dir in the ./configs/GraphCastTp.yaml, which set the directory for dataset.
The ./dataset is hosted with the following directory structure:
├── statistic
│   ├── mean.npy
│   ├── mean_s.npy
│   ├── std.npy
│   └── std_s.npy
│   └── climate_0.5_tp.npy
├── train
│   └── 2018
├── train_static
│   └── 2018
├── train_surface
│   └── 2018
├── train_surface_static
│   └── 2018
├── valid
│   └── 2021
├── valid_static
│   └── 2021
├── valid_surface
│   └── 2021
├── valid_surface_static
│   └── 2021
Model Construction
If it is training code, run_mode='train' is set. You need a pre-trained ckpt of GraphCast. You could download ckpt. Modify the parameter of backbone_ckpt_path in the ./GraphCastTp.yaml.
[17]:
model = init_tp_model(config, run_mode='train')
logger = get_logger(config)
2023-12-05 06:21:28,126 - utils.py[line:165] - INFO: {'name': 'GraphCastTp', 'latent_dims': 512, 'processing_steps': 10, 'recompute': True, 'vm_in_channels': 3, 'em_in_channels': 4, 'eg2m_in_channels': 4, 'em2g_in_channels': 4}
2023-12-05 06:21:28,126 - utils.py[line:165] - INFO: {'name': 'GraphCastTp', 'latent_dims': 512, 'processing_steps': 10, 'recompute': True, 'vm_in_channels': 3, 'em_in_channels': 4, 'eg2m_in_channels': 4, 'em2g_in_channels': 4}
2023-12-05 06:21:28,127 - utils.py[line:165] - INFO: {'name': 'era5', 'root_dir': './dataset_tp', 'feature_dims': 69, 'pressure_level_num': 13, 'data_sink': False, 'batch_size': 1, 't_in': 1, 't_out_train': 1, 't_out_valid': 20, 't_out_test': 20, 'train_interval': 1, 'valid_interval': 1, 'test_interval': 1, 'pred_lead_time': 6, 'data_frequency': 6, 'train_period': [2018, 2018], 'valid_period': [2021, 2021], 'test_period': [2022, 2022], 'patch': False, 'rollout_steps': 1, 'num_workers': 1, 'mesh_level': 5, 'grid_resolution': 0.5, 'tp': True, 'tp_dir': './dataset_tp/tp_log_data', 'h_size': 360, 'w_size': 720}
2023-12-05 06:21:28,127 - utils.py[line:165] - INFO: {'name': 'era5', 'root_dir': './dataset_tp', 'feature_dims': 69, 'pressure_level_num': 13, 'data_sink': False, 'batch_size': 1, 't_in': 1, 't_out_train': 1, 't_out_valid': 20, 't_out_test': 20, 'train_interval': 1, 'valid_interval': 1, 'test_interval': 1, 'pred_lead_time': 6, 'data_frequency': 6, 'train_period': [2018, 2018], 'valid_period': [2021, 2021], 'test_period': [2022, 2022], 'patch': False, 'rollout_steps': 1, 'num_workers': 1, 'mesh_level': 5, 'grid_resolution': 0.5, 'tp': True, 'tp_dir': './dataset_tp/tp_log_data', 'h_size': 360, 'w_size': 720}
2023-12-05 06:21:28,129 - utils.py[line:165] - INFO: {'name': 'adamw', 'initial_lr': 0.000125, 'finetune_lr': 3e-07, 'finetune_epochs': 1, 'warmup_epochs': 1, 'weight_decay': 0.1, 'gamma': 0.5, 'epochs': 100}
2023-12-05 06:21:28,129 - utils.py[line:165] - INFO: {'name': 'adamw', 'initial_lr': 0.000125, 'finetune_lr': 3e-07, 'finetune_epochs': 1, 'warmup_epochs': 1, 'weight_decay': 0.1, 'gamma': 0.5, 'epochs': 100}
2023-12-05 06:21:28,131 - utils.py[line:165] - INFO: {'summary_dir': 'GraphCastTp_latent_dims_512_processing_steps_10_recompute_True_vm_in_channels_3_em_in_channels_4_eg2m_in_channels_4_em2g_in_channels_4_adamw_oop', 'eval_interval': 10, 'save_checkpoint_steps': 5, 'keep_checkpoint_max': 10, 'save_rmse_acc': False, 'plt_key_info': True, 'key_info_timestep': [6, 72, 120], 'ckpt_path': '', 'backbone_ckpt_path': './dataset_tp/ckpt/GraphCast-device0-1_2008.ckpt'}
2023-12-05 06:21:28,131 - utils.py[line:165] - INFO: {'summary_dir': 'GraphCastTp_latent_dims_512_processing_steps_10_recompute_True_vm_in_channels_3_em_in_channels_4_eg2m_in_channels_4_em2g_in_channels_4_adamw_oop', 'eval_interval': 10, 'save_checkpoint_steps': 5, 'keep_checkpoint_max': 10, 'save_rmse_acc': False, 'plt_key_info': True, 'key_info_timestep': [6, 72, 120], 'ckpt_path': '', 'backbone_ckpt_path': './dataset_tp/ckpt/GraphCast-device0-1_2008.ckpt'}
2023-12-05 06:21:28,132 - utils.py[line:165] - INFO: {'name': 'oop', 'distribute': False, 'mixed_precision': True, 'amp_level': 'O2', 'load_ckpt': False}
2023-12-05 06:21:28,132 - utils.py[line:165] - INFO: {'name': 'oop', 'distribute': False, 'mixed_precision': True, 'amp_level': 'O2', 'load_ckpt': False}
Loss Function
LP Loss, relative error.
[18]:
sj_std, wj, ai = get_coe(config)
data_params = config.get('data')
loss_fn = LossNet(ai, wj, sj_std, data_params.get('feature_dims'), data_params['tp'])
loss_cell = CustomWithLossCell(backbone=model, loss_fn=loss_fn, data_params=data_params)
[19]:
trainer = GraphCastTrainerTp(config, model, loss_cell, logger)
trainer.train()
Model Evaluation and Visualization
After training, we use the 20th checkpoint for inference.
[33]:
inference_module = InferenceModuleTp(model, config, logger)
test_dataset_generator = Era5DataTp(data_params=data_params, run_mode='test')
test_dataset = Dataset(test_dataset_generator, distribute=False,
                       num_workers=data_params.get('num_workers'), shuffle=False)
test_dataset = test_dataset.create_dataset(data_params.get('batch_size'))
data = next(test_dataset.create_dict_iterator())
inputs = data['inputs']
labels = data['labels']
print(inputs.shape)
(1, 259200, 69)
[34]:
def unlog_trans(x, eps=1e-5):
    """Inverse transformation of log(TP / epsilon + 1)"""
    return eps * (ops.exp(x) - 1)

pred = inference_module.forecast(inputs)
labels = unlog_trans(labels).asnumpy()
pred = unlog_trans(pred).asnumpy()
print(labels.shape, pred.shape)
(1, 20, 360, 720) (1, 20, 360, 720)
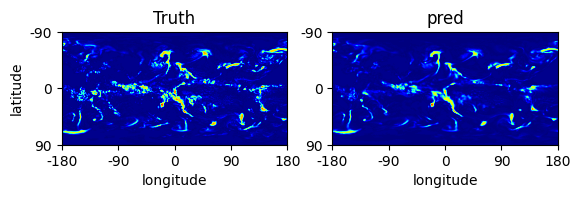
[43]:
def plt_comparison(pred, label, root_dir='./'):
    plt.subplot(1, 2, 1)
    plt.imshow(label, cmap='jet')
    plt.title('Truth')
    plt.xticks(np.arange(0, 721, 180), np.arange(-180, 181, 90))
    plt.xlabel('longitude')
    plt.yticks(np.arange(0, 361, 180), np.arange(-90, 91, 90))
    plt.ylabel('latitude')
    plt.subplot(1, 2, 2)
    plt.imshow(pred, cmap='jet')
    plt.title('pred')
    plt.xticks(np.arange(0, 721, 180), np.arange(-180, 181, 90))
    plt.xlabel('longitude')
    plt.yticks(np.arange(0, 361, 180), np.arange(-90, 91, 90))
    plt.savefig(f"{root_dir}/tp_comparison.png", dpi=150)
    plt.show()
[44]:
def trans_colorbar(data):
    ori = [0., 1., 10., 100]
    new_v = [0., 50., 75, 100.]
    trans = []
    for i in range(1, len(ori)):
        x = np.where((data > ori[i-1]) & (data <= ori[i]), (data - ori[i-1]) * (new_v[i] - new_v[i-1]) / (ori[i] - ori[i-1]) + new_v[i-1], 1.)
        trans.append(x)
    res = 1.
    for x in trans:
        res *= x
    return res

plot_pred = trans_colorbar(pred[0, 1] * 1000)
plot_labels = trans_colorbar(labels[0, 1] * 1000)
plt_comparison(plot_pred, plot_labels)